The coronavirus pandemic, which started in early 2020, caused a strong economic shock both in Finland and globally. On the one hand, the closure measures of society reduced the consumption of households and, on the other hand, changed its structure. At the same time, the savings rate grew. Staying at home increased the demand for food and products for home use, while transportation, going to restaurants and the use of several services decreased significantly. Simultaneously, exceptional measures and circumstances also affected production, for example, as a result of disruptions in the supply chains and absences of employees due to illness and quarantine.
Globally, the restrictive measures caused by the coronavirus pandemic led to a rapid reduction in greenhouse gas emissions. However, after the first waves of the pandemic, greenhouse gas emissions returned to previous levels quite quickly. In global emissions, therefore, the coronavirus pandemic was only a momentary low point. According to Statistics Finland's preliminary data, Finland's greenhouse gas emissions in 2020 decreased by 9 per cent from the previous year.
The carbon footprint of household consumption decreased in 2020
According to the latest calculations by the Finnish Environment Institute, the household carbon footprint [i] was 54.9 million tonnes of CO2 equivalent (CO2 eq.) in 2019 and 9.95 tonnes of CO2 eq. per capita [ii].
The carbon footprint of households' consumption in 2020 was approximately 52.6 million tonnes of CO2 equivalent [iii]. This was about 2.4 million tonnes of CO2 eq., or 4 per cent less than in 2019. This is the lowest value for the carbon footprint time series assessed by SYKE.
Travel and mobility decreased, food consumption grew
And how was the change in consumption volume and allocation caused by the coronavirus pandemic reflected in the carbon footprint structure? The biggest decreases in the carbon footprint were caused by decreases in travel and mobility (Figure 1). Emissions from travel abroad decreased by over one million tonnes of CO2 eq., which is a drop of over 70 per cent from 2019. The carbon footprint of consumption of transport services decreased by around 800,000 tonnes of CO2 eq., which corresponds to a decrease of over 40 per cent from the previous year. The carbon footprint was particularly affected by the decline in travel by air, ship and train. The carbon footprint of private vehicle use decreased by only around 4 per cent but, due to the high emission factor of fuels, the emission reduction was over 500,000 tonnes of CO2 equivalent.
The closure measures of society and time spent in homes were reflected in the carbon footprint of accommodation and food services, which decreased by around 500,000 tonnes of CO2 equivalent. Less clothing and footwear were also purchased, which decreased emissions by around 260,000 tonnes of CO2 equivalent.
In the culture and leisure categories of consumable goods, the coronavirus pandemic had an impact in two directions. More consumer electronics and various leisure and recreational equipment were purchased than in the previous year, which had an increasing effect on the carbon footprint. However, consumption of cultural and leisure services and package tours was clearly lower than before, which pushed the carbon footprint of the whole consumable goods category to a level lower than in the previous year.
The main factor that raised the carbon footprint of households' consumption was the growth in the consumption of plant and animal-based food. Teleworking and distance education meant a significant increase in home cooking. The carbon footprint of food grew by over 800,000 tonnes of CO2 equivalent. The carbon footprint of plant-based food and non-alcoholic beverages increased by 10 per cent and that of animal-based food by seven per cent.
Staying at home also increased the consumption of household furniture, household appliances, and tools and supplies for the home and gardening, which increased the carbon footprint by over one hundred thousand tonnes of CO2 equivalent.
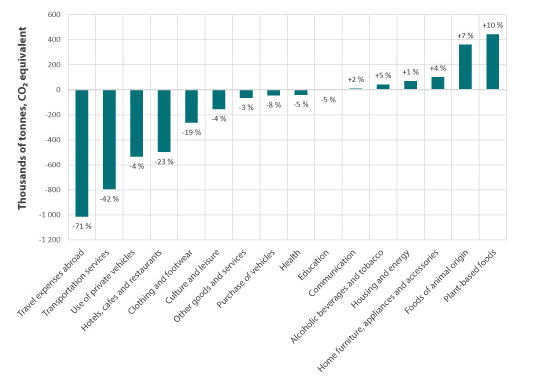
Figure 1. Change in the carbon footprint 2019–2020 by consumable good category (thousand tonnes of CO2 eq.). The percentage shows how much the carbon footprint of consumable goods categories changed from 2019 to 2020. © SYKE
The big picture of carbon footprint structure did not change
Although the percentage change in the carbon footprint of some categories of consumable goods was big, the distribution of the carbon footprint of households among the different categories of consumable goods was largely in line with the structure of previous years. The use of private vehicles as well as housing and energy each accounted for about a quarter of the carbon footprint, and food for about a fifth (Figure 2). The remaining 29 per cent consisted of other consumption of goods and services.
In the use of private vehicles, fuels and lubricants were the largest source of emissions. In housing, electricity consumption and heating accounted for the majority of the carbon footprint. Slightly more than half of the carbon footprint of consumed food was made up of food of animal origin. Of the carbon footprint of other goods and services, the most important categories of consumption were culture and leisure (cultural and recreational services, entertainment electronics, various leisure and recreational equipment), household furniture, household appliances and accessories, and miscellaneous other goods and services.
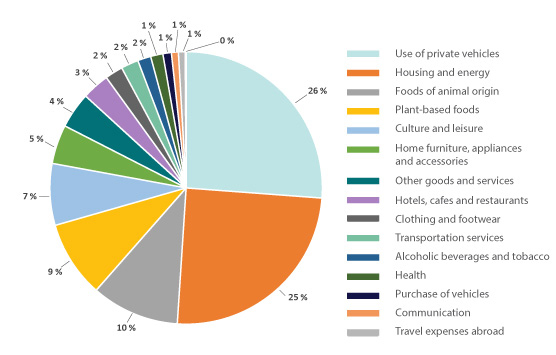
Figure 2. The division of the carbon footprint of Finnish households into consumable goods categories in 2020. © SYKE
The effect of the coronavirus pandemic on carbon footprints is relatively small and possibly transient
What was the impact of the first year of the coronavirus pandemic on the overall carbon footprint of households?
The carbon footprint of households has decreased by about 10 per cent in the time between 2000–2019. In the second half of the period under review, emission reduction measures have been on the right track, resulting in a decrease of the carbon footprint of 26% between 2010 and 2019. During the pandemic, from 2019 to 2020, the carbon footprint decreased by around 4 per cent, which represents a rather moderate annual change. The annual change in the carbon footprint has varied between -13% and +10% during the period under review.
How permanent is the change in consumption volume and allocation? One key factor behind the lower consumption was the increased savings rate. This means that households saved a clearly higher share of their disposable income in 2020 than in 2019. Lower consumption resulted in a smaller carbon footprint.
Quarterly household consumption data show that the previously stalled consumption and savings have started to flow again and the level of consumption is increasing. While lower consumption has been the result of restrictions and closure measures, a return to pre-pandemic levels of consumption is expected. The same applies to the allocation of consumption: the consumption of many services has simply been impossible. Here, too, a correction is expected towards past consumption.
The first year of the coronavirus pandemic decreased and changed the consumption of households because of necessity. More permanent changes may result from new insights into leisure, mobility, tourism or eating. In addition, consumption patterns and lifestyles are shaped by factors other than the coronavirus pandemic. These include, for example, digitalisation, advertising and the provision of climate-friendly products and solutions. Changes in lifestyle also have an impact on the carbon footprint, but the direction is not unequivocal. However, a return to the consumption of services rather than the purchase of goods would support a reduction in the carbon footprint in the future.
During the current year, the Finnish Environment Institute will continue its work on assessing and analysing the carbon footprints of households, municipalities and regions.
Senior Research Scientist Hannu Savolainen, Researcher Mari Heikkinen and Researcher Tero Heinonen
Finnish Environment Institute
Unlinked Sources
Savolainen, H., Heinonen, T., Heikkinen, M. & Nissinen, A. 2021. Kotitalouksien kulutuksen kasvihuonekaasupäästöt 2000–2019. Unpublished spreadsheet and related manuscript.
References
[i] The carbon footprint includes greenhouse gas emissions (carbon dioxide, methane, nitrous oxide, and F-gases, usually expressed in carbon dioxide equivalent) from the production and use of products and services consumed by households.
[ii] The figures presented have been calculated taking into account the changes in the emission factor of imported products by product category.
[iii] The carbon footprint of household consumption in 2020 was estimated in 2021 using the updated calculation method. As not all the data related to greenhouse gas emissions in 2020 were available, the calculation used the 2019 consumable good-specific emission factors. Roughly speaking, the emission factor describes the amount of emissions per euro value during the production and use of a consumable good or service. Thus, when the carbon footprints for 2019 and 2020 have been calculated using the 2019 consumable good-specific emission factors, the presented results describe the impact of the volume and allocation of consumption on the carbon footprints. A more detailed calculation for 2020 will be carried out in the future, when all the necessary data is available.